SEO Version


www.ebizguides.com
106
Energy
STATISTICS OF THE MINING SECTOR
% Gross Domestic Product
Mining GDP
Exploitation of mines and quarries
Production of Mineral non-metallic products
Participation of the mining GDP as a
percentage of the total GDP
Participation of the GDP (exploitation of
mines and quarries) as a percentage
of the total GDP
Participation of the GDP (manufacturing of
mineral non-metallic products) as a
percentage of the total GDP
Variation of the mining GDP
1999
185.155
61.268
123.887
1,2
0,4
0,8
2000
207.448
68.597
138.851
1,3
0,4
0,9
0,08333
2001
215.353
70.872
144.481
1,3
0,4
0,9
0
2002
232.696
73.543
159.153
1,3
0,4
0,9
0
2003
233.735
75.685
158.050
1,3
0,4
0,9
0
2004
244.365
80.840
163.525
1,2
0,4
0,8
- 0,0769
2005
257.609
82.176
175.433
1,2
0,4
0,8
0
2006
275.631
85.522
190,109
1,3
0,4
0,9
0,08333
2007
286.264
87,303
198,961
1,3
0,4
0,9
0
2008
308.900
92.817
216.083
1,3
0,4
0,9
0
2009
318.757
97.272
221.485
1,3
0,4
0,9
0
Source: Viceministry of Mining
Source: Viceministry of Mining
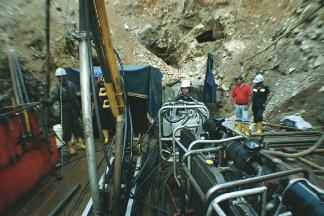
Nambijamines. Source: Viceministry of Mining
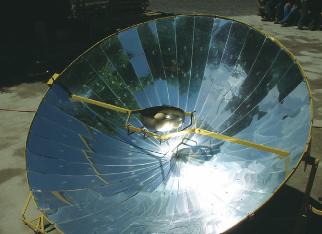
Source: Hidroespol
Theremany uses of the solar energy, even to boil eggs
The projected increase in production for the year 2011
is 10% over2010. It is also necessary to mention that
this production corresponds to small-scale mining.
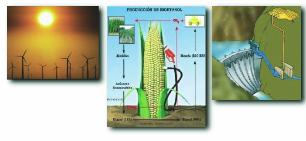
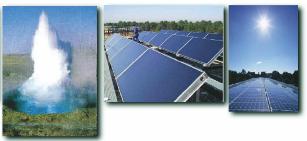
4) RENEWABLE ENERGIES
On March 22, 1967 there the first barrel of oil was
extracted in Ecuador. Since then, the Ecuadorian
economy was highly dependent on oil revenues.
Unfortunately, there revenues are not sufficient for
a balanced, dynamic and self-sufficient development
of the national economy, since they imply risks of
increasing the external debt, poverty, inequality, en-
vironmental destruction and cultural disintegration.
Nowadays, the Ecuadorian government is commit-
ted to support the development of renewable energy
and energy efficiency as a mean to diversify energy
sources and prepare the way for the post-oil era.
Powered by FlippingBook Publisher