SEO Version


127
www.ebizguides.com
Industry and Trade
TRADE CHAPTER
Foreign trade of goods and services
With dollarization, Ecuador has been undergoing a
process of increasing its imports and contracting ex-
ports. However, this process has been reversed and
in recent years Ecuador has had a growing surplus in
its trade balance, from $550 million in 2005 to $1.462
million in 2006, from $1,261 in 2007 to $1,096 million
in 2008. In 2009 the process has changed and shift-
ed from a surplus to trade balance deficit of $332.38
million. One of the main reasons for this variation
has been the fall of oil prices during the first half of
2009. Oil exports have gone from $11,672.84 million
in 2008 to $6964.59 million in 2009.
Trade Opening (X+M/PIB Y M/PIB)
(X+M)/PIB
Major trading partners (Import and Export)
The geographical pattern of Ecuadorian trade is ex-
plained in two axes. The first is the United States,
clearly, Ecuador’s main trading partner. Much of Ec-
uador’s exports to the United States is represented
by oil. The second axis is the regional trade with
South American countries and, in particular, with Co-
lombia and Venezuela. It also trades with the EU,
represented mainly by Italy, Spain and Germany, but
to a lesser extent. Asian countries still represent a
very small portion of the Ecuadorian trade, but this
is a a growing market with a lot of potential. The fig-
ures for 2009 show that around 57.42% of Ecuador’s
exports are concentrated in five countries, which
include the United States with (33.46%), Panama,
(14.47%), Peru (6.77% ), Chile (6.42%) and Co-
lombia (4.89%). Spain is in the tenth position with a
market share of 2.29%. Grouping countries in major
international markets after the U.S., the largest des-
tination market for Ecuadorian exports is the CAN
(Andean Community of Nations), which participates
with 21.3% of total exports.
Regarding imports, the absolute number in 2009 is
53% 58% 59% 68% 54,20%
26% 27% 28% 33% 27,40%
2005 2006 2007 2008 2009
2005 2006 2007 2008 2009
Spanish Economic and Commercial Bureau
$14.072 million, a 19.2% less than in 2008. The de-
cline has been influenced mainly by the decline in
foreign purchases of fuels, lubricants and raw ma-
terials for the industry. The main suppliers of Ecua-
dor are ranked in the following order: United States
(25.43%), the Andean Community (15.09%); by
country: United States followed by China, Colombia,
Venezuela, Brazil, Peru, Mexico and Japan. Spain,
with a share of 1.12%, has fallen to seventeenth po-
sition and is the fourth within the EU after Germany,
Italy and Belgium.
Main sectors of goods (Import and Export)
The sectoral pattern is characterized by imports of
industrial goods, consumer goods and the export of
primary products. The oil case perfectly illustrates
this pattern because Ecuador is a major exporter of
oil but also imports large quantities of refined petro-
leum products, which demonstrates the weakness
of the country’s industrial sector. Imports, goods are
divided into industrial raw materials 25.28% (3.557
million USD), fuels 16.58% (2.333 million USD), in-
dustrial capital goods 18.67% (2.626 million USD).
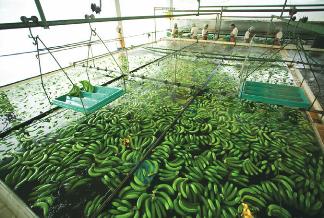
Processing banana
Main sectors of services (Import and Export)
Ecuador is a major exporter of services and this
situation is clearly reflected in the chronic deficit
in its balance of services. The balance in 2007
was -1.371 million, equivalent to 2.1% of GDP.
In 2008 the services balance reaches a negative
value of -1.641 million. And in 2009 it reached a
value of -1.389 million.
Although the balance of payments is not recorded
as an export of services, remittances from
Ecuadorean emigrants abroad are an important
support for the local economy. In 2007, this
concept was 3.087 million dollars, of which
approximately 41.7% were from Ecuadorians
settled in Spain. In 2008, the figure was 2,821
million dollars of which 41% came from Spain.
In 2009 it was $ 2.495 million, significantly below
the 2008 figure, which represented a decrease of
11.57%.
18.67% (2.626 million USD).
Powered by FlippingBook Publisher