|

|

 CENTRAL BANK OF LIBERIA CENTRAL BANK OF LIBERIA |
Mr. Elie E. Saleeby
Chairman of Board of Governors and Executive Governor
Contacts:
P.O. Box 2048
Monrovia - LIBERIA
Tel: (231) 226 991
Tel: (231) 226 991
Fax: (231) 226 144 (231) 226 144
or
Mr. Nathaniel R. Patray, III
Executive Director - Administration
Tel: (231) 227 685 / 227 928
|
| THE BANK |
The establishment on March 18, 1999, of the Central Bank of Liberia as an operationally independent agency with the traditional mandate of a full-fledged central bank has brought the first chapter in the resuscitation of Liberia's banking industry to a successful conclusion.
The Bank's principal objective is to achieve price stability in Liberia. Additionally, the Bank is charged inter-alia, with the functional responsibility for providing regulatory oversight of the banking system and serving as the banker, fiscal agent and advisor to the Government on monetary and financial matters.
The Government has begun the process of transferring its accounts to the Bank, and the commercial banks have opened current and required reserve accounts with the Bank. The currency reform program has been successfully implemented (bank notes have been exchanged and new coins introduced) and preparations are now well underway for destruction of the old bank notes. The Central Bank has also begun its vigilant supervisory oversight of the banking system with a view to protecting the soundness and integrity of the system, as well as the interest of depositors. In this regard, the Bank has issued a comprehensive set of prudential guidelines aimed at protecting the interest of depositors and forestalling bank failure. Noteworthy among these guidelines were those dealing with capital adequacy, liquidity, loan classification and provisioning, risk concentration and exposure limits, and connected party/insider lending. Furthermore, when the circumstances have required, the Bank has taken bold and decisive actions in the bid to protect depositors. The measures taken vis-à-vis LUBI is clearly a case in point. Last but not least, the Bank has assumed its responsibility for administering and supervising inter-bank clearing activities.
| HISTORICAL DEVELOPMENT |
Prior to the 1990s, the Liberian monetary arrangement consisted of two currencies namely, the Liberian five-dollar banknotes and the US dollar. Officially, the exchange rate between the two was L$1 to US$1. During this period, the monetary situation became increasingly difficult. First, due to capital flight, following the 1980 military coup, the economy faced severe liquidity constraints. Second, as a response to the liquidity constraints, the government resorted to an expansionary monetary policy through the minting of and putting into circulation Liberian five-dollar coins. The large increase in Liberian dollars in circulation amidst the continuing outflow of US dollars led to development of a thriving parallel market where the exchange rate increased to about L$3 per US$1. The civil crisis exacerbated the situation to an extent that the parallel Market rate increased to L$80 per US$1 in 1996. The currency arrangement also changed from a two-currency arrangement to three ("JJ", "Liberty" and US$) with varied exchange rates.
In terms of the banking industry, it had always maintained a mixture of indigenous and foreign banks since the 1960s. Prior to the civil crisis of 1989, the banking industry, like most other industries of the economy, exhibited relative growth both in terms of the number of institutions and assets. The number of operating commercial banks increased from 8 in 1987, to 14 by the end of the first quarter of 1990. However, there was a sudden setback to this momentum arising from the onset of the civil crisis. The environment of heightened uncertainty alongside the severe loss of liquidity negatively impacted the viability of these institutions. Added to that, the banks were targeted to meet the growing resource needs of the government during the war years. Resources transferred from the financial sector to the government were not repaid on time, thus causing a liquidity crisis.
Due to the devastating impact of the war on the banking sector, particularly on its fixed assets and loan portfolios, the industry became crippled. Loans became non-performing due to debtors' inability to pay while the collaterals either became illiquid or were destroyed during the crisis. The growing uncertainty and the drastic reduction in lucrative business opportunities finally prompted the closure of a number of banks. By the end of 1997, only 4 banks were operating.
All the above factors, among others, led to a general loss of confidence in the financial sector. Recognizing the seriousness of the situation, the government embarked on an approach to redefine the post-war monetary and financial policy stance through a restructuring program including the promulgation of a comprehensive Financial Institution Act and the Central Bank of Liberia Act that transformed the erstwhile National Bank of Liberia into a full-fledged central bank.
| THE CURRENT SITUATION AND OUTLOOK |
 Monetary Policy Monetary Policy |
During the period under review, the Bank harmonized the existence of the two domestic currencies by the introduction of a family of new Liberian dollar banknotes. This was a major achievement of the Central Bank as the exercise was overwhelmingly successful. The Bank also initiated the adoption of a policy stance on reserve requirement, Bank Rate and other prudential guidelines, including commercial bank reporting requirements. In addition, the Bank has gradually introduced measures that are geared towards the creation of a strong financial system. Data collection from commercial banks and the timeliness of reporting have improved considerably. These efforts have made monetary data more accurate and reliable as well as availing to policy makers, a more predictable policy environment for the conduct of prudent monetary policy.
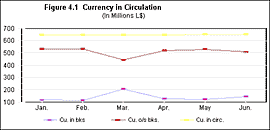
| Currency In Circulation |
During the period under review, currency in circulation rose by 1.0 percent to L$653.5 million of which currency outside banks constituted about 77.9 percent. Commercial banks' vault cash accounted for 22.2 percent or L$144.7 million of currency in circulation. For the six-month period, currency in circulation was relatively stable except for the last two months when it rose slightly by 0.3 percent. This rise was reflected in changes in commercial banks' vault cash (Table 4.1).
For the period under consideration, the components of currency in circulation showed infrequent patterns, particularly in March, as currency outside banks fell by 16.9 percent to L$442.8 million while currency in banks rose significantly to L$205.3 million or by 79.0 percent. This development, which was unsustainable, however, showed a resemblance of some movement towards convergence in currency outside banks and currency in banks (Figure 4.1).
see table
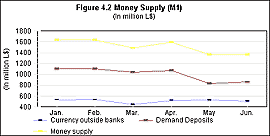
| Money Supply (M1) |
Money supply or narrow money, comprising currency outside banks and demand deposits, was relatively stable from the onset of the year, particularly during the first two months. However, there was noticeable decline in M1 during the third month but later recovered at the end of April when it grew by 7.3 percent. The initial fall of M1 in March was the result of a combination of the declines of currency outside banks and demand deposits. The contractions in demand deposits and currency outside banks can be traced to the monetary authorities pronouncement on the currency exchange exercise in which it called on holders of cash to deposit their holdings within the banking system in order to ensure a smooth exchange of their cash.
However, the contraction in currency outside banks was temporary but rose dramatically, in April, by 17.7 percent to L$521.3 million. This development further demonstrates the public strong desire to hold cash outside of the banking system. The persistent rise of currency outside banks can also be traced to developments taking place in currency in circulation, as currency in circulation has risen slightly from L$648.1 million in April to L$653.5 million in June or by 0.9 percent.
Also, the component variable of M1, i.e. demand deposits remained relatively stable up to the end of April. However, it fell significantly in the subsequent months. It fell by 20.1 percent to L$856.9 million at the end of June. This development impacted significantly on the money supply (M1) as it fell, for the same period, by 14.3 percent. For the six-month period, money supply (M1) declined from L$1,635.4 million to L$1,365.7 million or by 16.5 percent. This development was purely influenced by the decline of demand deposits.
see table
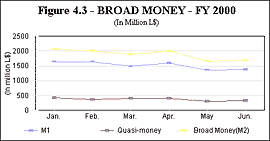
| Broad Money (M2) |
For the entire six-month period, Broad Money or overall liquidity reflected a downward trend, indicating a decline in monetary growth. As indicated in Table 4.3, it fell by nearly 18.3 percent from L$2,056.4 million to L$1,681.3 million. This decline was mainly attributed to the general fall in demand deposits and quasi-money (savings and time deposits). Table 4.3 shows that declines in these components of Broad Money were most significant in the latter period under review, particularly for the month of May. Demand deposits fell from L$1,103.2 million in January to L$829.9 million in May and quasi-money from L$421.0 million to L$296.9 million over the same period.
|
The above situation is largely attributed to an adjustment made in the commercial banks' deposits to account for the isolation of the deposits of a distressed commercial bank that was temporarily closed by the Central Bank. The isolated deposit, classified as the "restricted deposit" of the temporarily closed bank was about L$166.1 million.
In addition, the fall in Broad Money may be a manifestation of the public's desire to hold cash rather than to maintain savings in banks during this period. This may suggest a decline in the level of confidence in the banking system as well as skepticism about the currency exchange exercise. Following the clarification of the temporary closure of the bank to the public and the success of the currency exchange exercise, the public's confidence level began to increase, albeit gradual. This is reflected in the increases in deposits for the month of June (Table 4.3).
see table
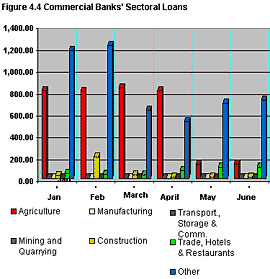
| Commercial Banks' Loans by Economic Sectors |
Commercial banks' outstanding credits and advances to all the economic sectors stood at L$949.0 million at the end of June 2000. This indicated an absolute decrease for the six-month period of L$1,082.6 million or 53.3 percent. The fall in commercial banks' total credits was largely influenced by agriculture and "Other" sectors (services, personal, GOL, Central Bank of Liberia, Public corporations, etc.) as they both declined substantially from a peak of L$798.8 million and L$1,168.3 million to L$126.3 million and L$711.3 million, respectively (Table 4.4 and Figure 4.4). Although the dramatic fall in commercial banks' credits for the six-month period was attributed to the decline in credits to the agriculture and "Other" sectors, the trend further suggests that the banks had significantly reduced their financial exposure in terms of credits to the public. Other contributing factors may also be due to the sluggishness in overall liquidity, particularly the downturn in deposits and probably the general cautiousness that preceded the currency exchange exercise.
On average, for the period under consideration, the "Other" sector accounted for over 56.9 percent of all commercial banks credits to all the economic sectors. At the end of June, the "Other" sector accounted for about 75.0 percent of total credit thus being the single largest user of commercial banks' funds (Figure 4.5). The Government, which is a sub-sector of the "Other" sector, has been the single largest beneficiary of credit, accounting for about 29 percent and 52.1 percent for the first and the second quarters, respectively.
The decline in credit to the rubber industry, as a sub-sector of agriculture, largely influenced the significant fall of total credit to agriculture (L$121.3 million) at end of June. Rubber, which accounted for about 87.4 percent of total credit in the agricultural sector in January, plummeted to 1.2 percent of total credits in the same sector in June, 2000. The decline in aggregate agricultural credits was mainly the result of a substantial repayment of about L$600 million to one of the commercial banks.
In general, the commercial banks' loans to the economic sectors consistently declined except for the month of June, when total loans slightly rose by 4 percent to L$949 million from L$912.5 million in May. This increase was particularly influenced by credit to the Government of Liberia which accounts largely the result of accumulated arrears due banks.
see table
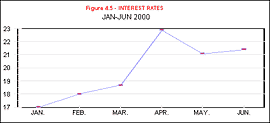
| Interest Rates |
The Bank Rate has been stable and unchanged for a protracted period while commercial bank lending rates fluctuated over time. For the period under review, the Bank Rate remained at 8.0 percent while commercial banks average lending rate rose from a low of 17.0 percent to a high of 22.9 percent (Table 4.5 & Figure 4.5). Commercial banks' average lending rate grew moderately for the first quarter of 2000. However, from the onset of the second quarter, it recorded its highest peak at 22.9 percent and later declined to 21.1 percent. It is also observed that there is a wide gap between commercial banks' lending rate and the rate of inflation despite both rates moving in the same upward direction. The rate of inflation rose from 3.8 percent to 10.4 percent over the period January to June 2000, while the average lending rates rose from 17 to 21.4 percent over the same period. The rise in the average lending rate may likely be due to the banks' sensitivity to the risk factor. This level of interest rate may serve as an adequate cushion to absorb the risk.
Table 4.5 INTEREST RATES
| End of period |
INTEREST RATES |
| JAN. |
17.00 |
| FEB. |
18.00 |
| MAR. |
18.67 |
| APR. |
22.88 |
| MAY. |
21.08 |
| JUN. |
21.40 |
| EXCHANGE RATE DEVELOPMENTS |
In the 1990s, Liberia had a multiple currency arrangement. The exchange system was, de facto, characterized by several exchange rates as already mentioned among the three currencies. Officially, however, there was a 1:1 parity between the US dollar and the different Liberian five-dollar notes. At the end of August 1998, the official 1:1 parity was rescinded and replaced by a market-determined rate.
In 1998, the average exchange rate per US dollar was L$41. During this period, the lowest rate recorded was L$34.35 in December. For the 1999 period, the rate ranged between L$41 - L$43 until December when it appreciated to L$37. The appreciation in the rate for both years was due to the onset of the Christmas and New Year holidays, which were characterized by an upsurge in remittances from abroad.
In the process of the introduction of the new currency, there were speculations that the local currency would drastically depreciate. Contrary to these speculations, the rate remained relatively stable at about L$41.50. Over the focal period under review (January -June 2000), the stability was generally maintained. The rate fluctuated only slightly within the
range of L$40-L$42, registering an average rate of L$41 (Figure 4.6). This stability is not surprising considering that the introduction of the new currency did not result in increased Liberian dollars in circulation.
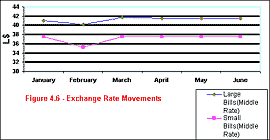
It is interesting to note that the middle rate for small denominations of US dollars also remained reasonably stable for most part of the six months. As seen above, except for February, when the middle rate for small denominations was L$35.25 per US dollar, the rate remained stable at L$37.50 per US dollar. This situation suggests that the mild fluctuation experienced in the exchange rate was mainly influenced by the large denominations of the US dollar.
A stable market-determined exchange rate is generally considered important as an anchor for low inflation. This in turn facilitates the creation of a favorable environment for long-term growth. While there are other major political, financial, and administrative factors to ensure long-term growth, the current trend in the exchange rate is encouraging.
|
| Central Bank's Balance Sheet |
| (UNAUDITED) |
|
|
|
|
|
| Thousand Liberian dollars |
|
|
|
|
|
| ASSETS |
Feb-00 |
Mar-00 |
Apr-00 |
May-00 |
Jun-00 |
| Cash Balances |
4,680 |
4,206 |
320,404 |
204 |
203 |
| Bank Balances |
(42,318) |
(44,702) |
(34,169) |
(19,270) |
(31,987) |
| Loans & Advances to Local Banks |
|
|
|
|
|
| and Advances to Institutions |
81,425 |
81,425 |
81,425 |
81,425 |
81,425 |
| IMF Quota subscription |
103,389 |
103,389 |
103,389 |
103,389 |
103,389 |
| Loans & Advances to GOL |
9,777,967 |
9,843,308 |
9,908,383 |
9,344,519 |
9,344,519 |
| GOL IMF Obligations |
17,707,539 |
18,186,815 |
17,758,890 |
17,758,890 |
17,651,908 |
| GOL Securities |
271,572 |
271,672 |
271,722 |
271,772 |
271,822 |
| Other Current Assets |
137,633 |
138,891 |
108,700 |
43,783 |
44,340 |
| Fixed Assets |
39,424 |
39,861 |
40,115 |
41,844 |
45,881 |
| |
|
|
|
|
|
| Total Assets |
28,081,312 |
28,624,865 |
28,558,858 |
27,626,555 |
27,511,500 |
| |
|
|
|
|
|
| Liabilities & Shareholder's Equity |
|
|
|
|
|
| |
|
|
|
|
|
| LIABILITIES |
|
|
|
|
|
| |
|
|
|
|
|
| Deposits |
690,738 |
690,855 |
690,727 |
690,700 |
690,657 |
| Currency in Circulation |
652,145 |
652,145 |
652,145 |
652,145 |
653,465 |
| International Monetary Fund |
18,488,215 |
18,981,308 |
18,541,046 |
18,541,046 |
18,430,981 |
| West African Monetary Agency |
347,366 |
347,366 |
347,666 |
347,366 |
345,273 |
| Other Liabilities |
643,243 |
723,220 |
648,181 |
293,641 |
295,254 |
| |
|
|
|
|
|
| Total Liabilities |
20,821,707 |
21,394,894 |
20,879,764 |
20,524,898 |
20,415,630 |
| |
|
|
|
|
|
| Capital & Reserves |
|
|
|
|
|
| |
|
|
|
|
|
| Capital |
5,000 |
5,000 |
5,000 |
5,000 |
5,000 |
| Reserves |
7,254,604 |
7,224,971 |
7,674,094 |
7,096,658 |
7,090,871 |
| |
|
|
|
|
|
| Total Capital & Reserves |
7,259,604 |
7,229,971 |
7,679,094 |
7,101,658 |
7,095,871 |
| |
|
|
|
|
|
| Total Libilities & Capital |
28,081,312 |
28,624,865 |
28,558,858 |
27,626,555 |
27,511,500 |
Exchange Rate Developments(Liberian dollar per US dollar)
| Period |
Large bills1 |
Small bills2 |
Average4 |
| Buy |
Sell |
Middle3 |
Buy |
Sell |
Middle3 |
1999
January
February
March
April
May
June
July
August
September
October
November
December
Quarter 1
Quarter 2
Quarter 3
Quarter 4
|
43.67
42.42
40.57
41.00
41.48
41.95
42.33
43.23
42.86
42.36
38.23
36.52
42.22
41.48
42.81
39.04
41.39
|
44.04
42.68
40.77
41.59
42.73
43.05
43.55
44.33
43.84
43.29
39.08
37.87
42.50
42.46
43.91
40.08
42.23
|
43.86
42.55
40.67
41.30
42.11
42.50
42.94
43.78
43.35
42.83
38.66
37.20
42.36
41.97
43.36
39.56
41.81
|
33.89
30.56
30.00
30.00
30.00
30.09
30.50
31.98
31.51
30.10
30.00
30.00
31.48
30.03
31.33
30.03
30.72
|
34.15
30.77
30.15
30.31
30.50
31.06
31.50
32.95
32.49
30.62
35.00
35.00
31.69
30.62
32.31
33.54
32.04
|
34.02
30.66
30.08
30.15
30.25
30.57
31.00
32.47
32.00
30.36
32.50
32.50
31.59
30.33
31.82
31.79
31.38
|
38.94
36.59
35.35
35.74
36.20
36.54
36.97
38.12
37.68
36.59
35.58
34.85
36.96
36.16
37.59
35.67
36.60
|
Year 2000
January
February
March
April
May
June
Quarter 1
Quarter 2
|
40.50
39.70
41.31
41.00
41.00
41.00
40.50
41.00
|
41.50
40.66
42.24
42.00
42.00
42.00
41.47
42.00
|
41.00
40.18
41.78
41.50
41.50
41.50
40.99
41.50
|
35.00
32.75
35.00
35.00
35.00
35.00
34.25
35.00 |
40.00
37.75
40.00
40.00
40.00
40.00
39.25
40.00 |
37.50
35.25
37.50
37.50
37.50
37.50
36.75
37.50 |
39.25
37.72
39.64
39.50
39.50
39.50
38.87
39.50 |
Notes: 1 US dollar bank notes of denomination 5 and higher.
2. US dollar bank notes of denomination 1 and 2.
3. Average of buying and selling rates.
4. Average of middle rates for large and small bills.
Data taken from the Financial & Economic Bulletin of the CBL
(Jan. to June 2000) |
Table 4.1 CURRENCY IN CIRCULATION- FY2000(In millions L$)
| End of Period |
Currency inside Banks |
Currency outside Banks |
Currency in Circulation |
| Jan. |
115.4 |
532.2 |
647.6 |
| Feb. |
114.7 |
532.9 |
647.6 |
| Mar. |
205.3 |
442.8 |
648.1 |
| Apr. |
126.8 |
521.3 |
648.1 |
| May |
121.5 |
530.6 |
652.1 |
| Jun. |
144.7 |
508.8 |
653.5 |
|
Table 4.2 MONEY SUPPLY (M1 January - June 2000) (In Millions L$)
| |
Currency outside banks |
Demand Deposits |
Money supply |
| Jan. |
532.2 |
1,103.2 |
1,635.4 |
| Feb. |
532.9 |
1,104.9 |
1,637.8 |
| Mar. |
442.8 |
1,040.8 |
1,483.6 |
| Apr. |
521.3 |
1,071.3 |
1,592.6 |
| May |
530.6 |
829.9 |
1,360.5 |
| Jun. |
508.8 |
856.9 |
1,365.7 |
|
Table 4.3 BROAD MONEY - FY2000 (In millions L$)
| End of |
Currency |
Demand |
Money supply |
Savings |
Time |
Quasi-money |
Broad |
| Period |
outside banks |
Deposits |
M1 (1+2) |
Deposits |
deposits |
(4+5) |
Money-M2 |
| |
(1) |
(2) |
(3) |
(4) |
(5) |
(6) |
(3+6) |
| Jan. |
532.2 |
1,103.2 |
1,635.4 |
405.8 |
15.2 |
421.0 |
2,056.4 |
| Feb. |
532.9 |
1,104.9 |
1,637.8 |
353.7 |
13.2 |
366.9 |
2,004.7 |
| Mar. |
442.8 |
1,040.8 |
1,483.6 |
389.0 |
14.5 |
403.5 |
1,887.1 |
| Apr. |
521.3 |
1,071.3 |
1,592.6 |
390.5 |
14.6 |
405.1 |
1,997.7 |
| May |
530.6 |
829.9 |
1,360.5 |
284.2 |
12.7 |
296.9 |
1,657.4 |
| Jun. |
508.8 |
856.9 |
1,365.7 |
302.9 |
12.7 |
315.6 |
1,681.3 |
|
Table 4.4 COMMERCIAL BANKS' LOANS BY ECONOMIC SECTORS - FY 2000 (In millions L$)
| SECTORS |
Jan-00 |
Feb-00 |
Mar-00 |
Apr-00 |
May-00 |
Jun-00 |
| Agriculture |
798.8 |
792.4 |
823.0 |
799.7 |
121.5 |
126.3 |
| Mining & Quarrying |
0 |
0 |
0 |
0 |
0 |
0 |
| Manufacturing |
0 |
0 |
0 |
0 |
0 |
0 |
| Construction |
23.5 |
192.7 |
28.0 |
12.2 |
8.3 |
8.6 |
| Trans., Storage & Comm. |
0.5 |
0.4 |
0.5 |
0.1 |
0.1 |
0.1 |
| Trade, Hotel &Rest. |
40.5 |
38.4 |
27.7 |
71.2 |
98.7 |
102.6 |
| Other |
1,168.3 |
1,212.8 |
620.8 |
514.5 |
683.9 |
711.3 |
| TOTAL |
2,031.6 |
2,236.8 |
1,450.0 |
1,397.6 |
912.5 |
949.0 |
|
|
© World INvestment NEws, 2001.
This is the electronic edition of the special country report on Liberia published in Far Eastern Economic Review.
June 21st, 2001 Issue.
Developed by AgenciaE.Tv |
|
|
|
| |
|
|
|
|