
|

| 
Mr. Alphonso B. Gaye
Managing Director
Contacts:
Bushrod Island
P. O. Box 1849
1000 Monrovia 10 - LIBERIA
Tel: (231) 22 66 46
Fax: (231) 22 61 80
Cable address: NATPORT
Telex: 44275
or
Mr. Raymond Bruce, Sr,
Manager of Economic Planning & Development Department
Tel: (231) 22 66 59 - Ext. 119
Fax: (231) 22 61 80
E-mail: natport@liberia.net
|
 HISTORICAL BACKGROUND HISTORICAL BACKGROUND |
An Act of Legislature established the National Port Authority in 1967 (amended in 1970) as a state-owned enterprise to "manage, plan, and develop all ports within the Republic of Liberia". The National Port Authority (NPA) is one of Liberia's leading state-owned corporations. The Authority's network comprises four (4) ports: the Port of Monrovia, Buchanan, Greenville, and Harper.
 The Freeport of Monrovia The Freeport of Monrovia |
Is the largest port in the Authority's Network. The United States Military built it during World War II for strategic purposes. It handles most of the Authority's imported cargoes. Two breakwaters, 2,350m and 2,200m long, protect the harbor enclosing a basin of 300 hectares of protected water. The general cargo berths (the main pier) consists of an open piled, 610m long by 11m wide marginal wharf with a reinforced concrete deck. The main wharf serves coastal and main line vessels of the 2nd and 3rd generation.
 The Port of Buchanan The Port of Buchanan |
Is located some 170 miles southeast of Monrovia. The Liberia-American Swedish Mining Corporation (LAMCO), a joint venture company, to export the iron ore deposits of the Nimba Range, constructed it in 1960. Two breakwaters, 1,890m and 590m long protect the harbor. Inside the basin, a 255m long ore-loading quay is located adjacent to the deeper section of the harbor basin with a water depth of 12.95m below chart datum. Adjacent to the loading quay, a waiting berth for ore carriers is available. On the inner side of the secondary breakwater, a commercial quay, 334m long, is located with an available water depth of 10.15 m below chart datum. The access channel to the port provides ships a water depth of 14.95 m below chart datum and a channel width between the breakwaters of 210m.
 The Port of Greenville The Port of Greenville |
Is located in the southeastern region of the country, about 421 miles from the Freeport of Monrovia. A 400m long breakwater protects the harbor. There are two quays (70m and 180m long respectively) on the inner side of the breakwater for berthing facilities, with an existing water depth of 6m below chart datum. The Port was rehabilitated in the early eighties with loan from the German Development Fund. The port functions mainly as an outlet for the timber industry.
 The Port of Harper The Port of Harper |
It is located in the southeastern region of Liberia, near the boarder with the Ivory Coast, about 476 miles from the Freeport of Monrovia. The port was constructed in 1959, on the rocky Russwurn Island, by connecting the island to the main land with a causeway and by constructing a 150m long breakwater off Russwurn Island. A 100m long reinforced concrete pier with an available water depth of 5.50m provides berthing facilities. The port serves the timber industry of the southeastern hinterland.
 ORGANIZATIONAL STRUCTURE ORGANIZATIONAL STRUCTURE |
A Board of Directors appointed by the President of Liberia manages the Authority. It consists of fourteen (14) members comprising prominent citizens within the Liberian Society including businessmen. The Managing Director who is also Chief Executive Officer of the Authority serves as Secretary to the Board of Directors. Each member of the Board serves for a period of three years and may be reappointed by the President or may be removed for a cause.
The Board provides policy direction to the Corporation. The day-to-day management of the Authority is delegated to the Managing Director who is assisted by two presidential appointees, namely: (1) Deputy Managing Director for Administration and (2) Deputy Managing Director for Operations.
The Present Managing Director is Mr. Alphonso B. Gaye, assisted by Ms. Yvette A. Freeman and Mr. A. Vivion Cooke, Sr., Deputy Managing Director for Administration and Operations respectively.
 OPERATIONAL STRUCTURE OPERATIONAL STRUCTURE |
There are three (3) operational divisions of the Authority: the division of administration, the division of operations, and the division of finance. Below the division, there are nineteen (19) departments. The division of administration has six (6) departments, which contain a total of nine (9) sections; the division of operations has three (3) departments, which contain a total of twelve (12) sections; and the division of Finance has two (2) departments, which contain a total of twelve (12) sections. Outside of the divisions, there are eight (8) departments being supervised directly by the office of the Managing Director; these departments contain a total of fifteen (15) sections.
The Authority operates as unit with each port being considered as an operational division. Personnel, purchasing, financial and other management functions of the Authority are centralized.
 SERVICES SERVICES |
The National Port Authority provides services such as vessels handling, warehousing, and an oil jetty exclusively, for petroleum products.
 Pilotage Pilotage |
Pilotage is compulsory for all vessels entering and leaving the various Ports.
Towage
Towage facilities are available for all classes of vessels calling at the various Ports.
 Fire Service Fire Service |
There exists a Fire Service Unit to provide fire prevention and fighting services at the Freeport of Monrovia only.
 Security Security |
Security Unit operated by the Liberia Seaport Police protects the Port area. The Liberia Seaport Police is strong enough to provide security protection for all cargoes and warehouse facilities. The Liberian National Navy and other State Paramilitary Organizations compliment their efforts.
 Computerization Computerization |
Computerization (Network) function of the National Port Authority came into being during the latter part of 1999 for the Freeport of Monrovia only and limited to Accounting Personnel. Computerization will be extended to the Out Ports as the Authority's financial situation improves. Said exercise will target billing, traffic (including container tracking), accounting, purchasing, stores, operations, and statistical functions.
 Manpower Development Manpower Development |
The Maritime Sector remains one of the most vital and dynamic sectors of the global economy and international trade. The mode and structure of maritime trade and port operation continue to witness series of changes. In so doing, old setups are fast giving way to most scientific and sophisticated techniques; manpower requirements are also matching with changing time. As such, and as a matter of policy, the National Port Authority prioritizes manpower development through in-house, local and foreign programs. Furthermore, most of the Authority's staff received and continue to receive scholarship grants to attend the World Maritime University.
 FACTS AND FIGURES FACTS AND FIGURES |
Port Safety and IMO Conventions
Safety in Seaports requires compliance with the relevant conventions, codes, guidelines, recommendations and other multi-lateral instruments, which have helped to promote the present high standards of maritime safety within the international shipping industry. The inter-dependence and close relationship between ports and shipping, considered in the IMO instruments, can better be identified in the area of port operations as follows:
· pilotage and towage,
· Hydrographic surveys and provision of an accurate up-to-date harbour charts and hydrographic information,
· dredging (maintenance and capital)
· aids to navigation - provision of efficient, properly maintained buoyage system and communications system (shore to ship),
· provision of reception facilities for vessels,
· safety control at specialized terminals (for petroleum products and chemicals),
· port infrastructure - quays, workshop and repair facilities.
In this connection, Liberia, which is a Contracting Party to various IMO Conventions, is obligated to ensure that Liberian Ports comply with such reciprocal provisions to cover a wider sector of the International Maritime Transport System. Ensuring compliance requires that facilities and equipment for port marine services, such as tugs, aids to navigation, fire-fighting equipment, communications equipment, and facilities and guidelines for the training of port marine personnel comply with requirements and meet certain international standards.
 Uniformed System of Port Statistics (USPS) Uniformed System of Port Statistics (USPS) |
Port statistics is the indispensable tool for the determination of port performances. They provide Management the leverage to implement sound decisions with respect to corporate policies that would provide sustainable economic growth and development. They are represented by numerical data assembled and analyzed logically in accordance with a uniformed system designed for seaports known as the USPS. The USPS provides data and analytical information on cargo throughput, vessel traffic, equipment and port facility utilization and labour associated with port operations.
 Freeport of Monrovia Freeport of Monrovia |
The period under review, January 1st to December 31st, 1999 registered a total of 270 vessels with a summer dead weight tons (SDWT) of 2,958,626. When compared with 277 ships that berthed in 1998, there was a decrease of 7 vessels or 3 percent. Of the total 270 vessels handled during the period, container vessels registered the highest with 133 ships followed by General Cargo Ships 54, Coaster (Feeder Crafts) and Log Vessels 20 each, Tanker 13, Ro-Ro 11, Reefer 8, Passenger 4, Clinker (Bulk) 3, Tug 1, and Other 1.
| NUMBER AND NRT OF VESSEL THAT ENTERED
AND CLEARED AT THE FREEPORT OF MONROVIA JANUARY - DECEMBER 1999
| TYPE OF VESSEL | NO. | NRT | | Container | 133 | 631,806.0 | | General Cargo | 54 | 236,009.0 | | Relief (General) | 2 | 18,368.0 | | Coastal | 20 | 5,046.4 | | Tanker | 13 | 38,743.0 | | Passenger | 4 | 1,119.0 | | RORO | 11 | 103,904.0 | | Reefer | 8 | 10,302.0 | | Clinker (Bulk) | 3 | 39,929.0 | | Log | 20 | 81,741.0 | | Tug | 1 | 99.0 | | Other | 1 | 229.0 | | | | | Total
| 270 | 1,168,195.4 |
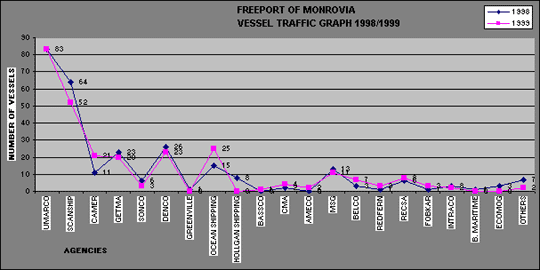
FREEPORT OF MONROVIA NUMBER AND
SDWT OF VESSELS BY AGENCIES JANUARY - DECEMBER 1998 AND 1999
see table and graph
 Outports Outports |
During the period under review, a total of 20 vessels with a corresponding SDWT of 116,876 berthed at the Port of Greenville indicating an increase of 2 vessels or 11 percent when compared to 1998. The Commercial Port of Buchanan registered a total of 13 vessels with a corresponding SDWT of 145,987 indicating a decrease of 9 vessels or 41 percent when compared to 1998; while, the Port of Harper registered 35 vessels with a corresponding NRT of 54,204.9 indicating an increase of 5 vessels or 17% when compared to 1998.
 Cargo Traffic Cargo Traffic |
For the period under review, the Authority netted a total cargo throughput of 713,407.53 metric tons indicating a 23 percent increase when compared with the 579,955.7 metric tons handled in 1998
see table
 Free Port of Monrovia Free Port of Monrovia |
During the period under review a total of 611,984.4 metric tons of cargo throughput was handled. A breakdown of 445,126.6 metric tons import cargo and 166,857.8 export cargo. This volume represents an increase of 98,423.8 or 19.2% compare with 513,560.6 metric tons handled in 1998.
For the container trade, 18,024 TEUS was handled representing an increase of 855 TEUS or 5% when compared to the 17,169 TEUS handled in 1998. Out of the total number of containers recorded, Umarco Shipping Line recorded the highest with 8,710 TEUS, followed by Denco 5,461 TEUS, Scanship 3,375 TEUS, Camer 470 TEUS and Oceanship 8 TEUS.
FREE PORT OF MONROVIA BREAKDOWN OF CARGO VOLUME HANDLED IN METRIC TONS
JANUARY 1- DECEMBER 31, 1999
see table
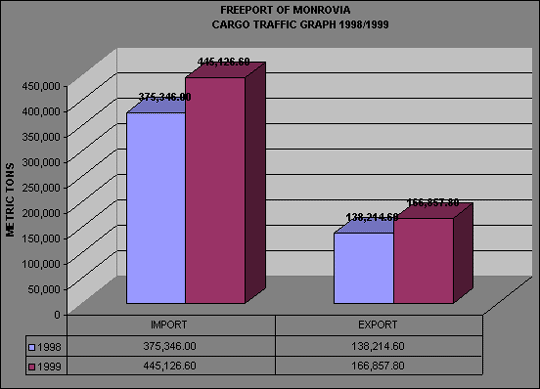
FREEPORT OF MONROVIA COMPARATIVE ANALYSIS OF IMPORT & EXPORT CARGO TONNAGES HANDLED (1998 AGAINST 1999)
IMPORT
1998 : 375,346.0 metric tons
1999: 445,126.6 metric tons
Marginal Change = 69,780.6
Percentage Change = +18.6%
EXPORT
1998: 138,214.6 metric tons
1999: 166,857.8 metric tons
Marginal Change = 28,643.2
Percentage Change = +20.7%
see graph
BREAKDOWN OF CONTAINER TRAFFIC IN UNITS & (TEUS) JANUARY - DECEMBER 1999
see table
CONTAINER TRAFFIC BY AGENCY IN UNITS AND (TEUS)
see table
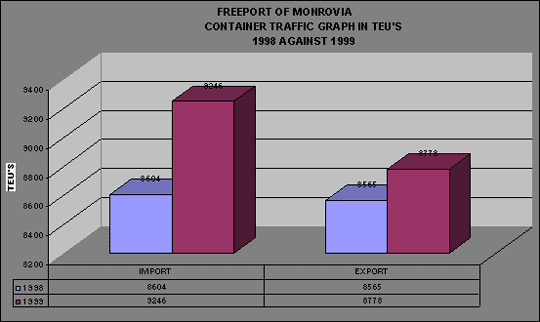
FREE PORT OF MONROVIA COMPARATIVE ANALYSIS OF IMPORT & EXPORT CONTAINER TRAFFIC IN TEU'S (1998 AGAINST 1999)
IMPORT
1998 : 8,604 TEUs
1999 : 9,246 TEUs
Marginal Change: 642
Percentage Change = +7.5%
EXPORT
1998 : 8,565 TEUs
1999: 8,778 TEUs
Marginal Change: 213
Percentage Change = +2.5%
see graph
 Outports Outports |
The Outports, which basically caters to the timber industry, handled a total throughput of 101,423.13 metric tons during the period under review. This indicates an increase of 53 percent when compared to the 66,395.14 metric tons handled in 1998. The breakdown is given hereunder:
SUMMARY OF CARGO THROUGHPUT IN CUBIC METRES & METRIC TONS 1998/1999
see table
COMPARATIVE ANALYSIS OF EXPORT TONNAGES HANDLED FOR THE OUTPORTS
(IN METRIC TONS) 1998 VS. 1999
1998: 66,395.14
1999: 101,423.13
Marginal Change = 35,027.99
Percentage Change = +53%
 PERFORMANCE INDICATORS Freeport Of Monrovia PERFORMANCE INDICATORS Freeport Of Monrovia |
The Performance Indicators are indices obtained from Statistical Analysis. They are the most direct means through which Management takes decision for planning future development program. The level of performance at the Freeport of Monrovia during the period under review recorded an upward trend in operational activities. Out of the total 270 vessels that berthed at the Freeport of Monrovia, 250 vessels were handled at the main quay where labor gangs are assigned in cargo operations.
Productivity of gangs assigned at the main wharf showed a positive upward trend, when compare with 1998. Total productivity rose from an average of 36.7 TNGH during 1998 to 71.6 TNGH tons per net gang hour in 1999.
The boom in productivity, comparing 1998 to 1999 was the result of several new and rehabilitated cargo handling equipment, that were put into the system. There was also a positive shift in delay from 4382.01 hours inefficiency to 4000.74 inefficiency as compared to 1998. This improvement in vessel turn around time is due to the availability of cargo handling equipment as compare to 1998.
The berth occupancy rate slightly dropped from 46.4% in 1998 to 45.9% in 1999, representing 1% change, which is negligible. The number of vessels per turn around time (TAT) at the main wharf in cargo operations dropped from 256 ships in 1998 to 250 ships in 1999.
VESSEL TURN AROUND TIME (TAT) PER SHIFT AT THE MAIN WHARF
see table
VESSEL AT THE MAIN WHARF AVERAGE PORT, BERTH AND WAITING TIMES IN HOURS
1998 AND 1999
see table
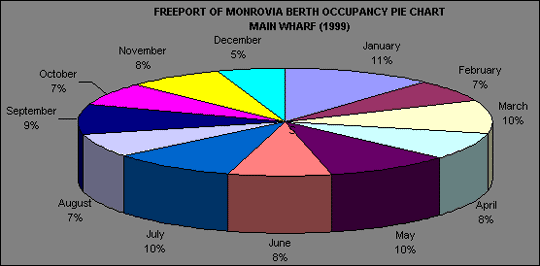
BERTH OCCUPANCY JANUARY - DECEMBER 1999
| MONTH | PERCENTAGE | | January | 64.5 | | February | 36.1 | | March | 54.3 | | April | 46.4 | | May | 54.3 | | June | 44.2 | | July | 53.9 | | August | 39.9 | | September | 48.9 | | October | 36.7 | | November | 41.3 | | December | 30.2 | | Total: | 550.7 | | Average | 45.9 |
see graph |
FREEPORT OF MONROVIA NUMBER AND SDWT OF VESSELS BY AGENCIES JANUARY - DECEMBER 1998 AND 1999
| AGENCY | NO. 1998 | SDWT | NO. 1999 | SDWT | | Umarco | 83 | 714,267 | 83 | 832,068 | | Scanship | 64 | 958,854 | 52 | 807,428 | | Camer | 11 | 118,352 | 21 | 254,401 | | Getma | 23 | 268,109 | 20 | 212,652 | | Sonco | 6 | 20,818 | 3 | 8,500 | | Denco | 26 | 418,754 | 23 | 437,130 | | Greenville Shipping | 1 | 497 | - | - | | Ocean Shipping | 15 | 132,991 | 25 | 150,396 | | Hollgan Shipping | 8 | 9,180 | - | - | | Bassco | - | - | 1 | 19,464 | | CMA | 2 | 7,160 | 4 | 17,366 | | Ameco | - | - | 2 | 1,300 | | MSG | 13 | 78,396 | 11 | 198,122 | | Belco | 3 | 3,156 | 7 | 8,481 | | Redffern | 1 | 450 | 3 | 1,969 | | Recsa | 6 | 3,588 | 8 | 4,500 | | Fobkar | 1 | 4,443 | 3 | 592 | | Intraco | 3 | 3,100 | 2 | 744 | | B. Maritime | 1 | 1,042 | - | - | | Ecomog | 3 | 11,545 | - | - | | Others | 7 | 3,014 | 2 | 3,513 | | Total: | 277 | 2,757,716 | 270 | 2,958,626 |
 |
CARGO TRAFFIC TREND OF THE AUTHORITY FOR THE PERIOD 1995 TO 1999
| YEAR | IMPORT | EXPORT | TOTAL THROUGHPUT | | 1999 | 445,126.6 | 268,280.9 | 713,407.5 | | 1998 | 375,346.0 | 204,609.7 | 579,955.7 | | 1997 | 384,152.3 | 85,931.7 | 470,084.0 | | 1996 | 218,801.6 | 49,627.8 | 268,429.4 | | 1995 | 243,769.8 | 31,456.9 | 275,226.7 |
|
FREE PORT OF MONROVIA BREAKDOWN OF CARGO VOLUME HANDLED IN METRIC TONS
JANUARY 1- DECEMBER 31, 1999
| DRY BULK | | IMPORT | | EXPORT | | TOTAL | | Clinker | | 64,000.0 | | - | | 64,000.0 | | LIQUID BULK | | | | | | | | Petroleum Product | | 86,478.2 | | 7.0 | | 86,485.2 | | Latex | | - | | 23,900.0 | | 23,900.0 | | Total: | | 86,478.2 | | 23,907.0 | | 110,385.2 | | GENERAL CARGO | | | | | | | | Rice | | 82,082.3 | | 5.0 | | 82,087.3 | | Frozen Cargo | | 9,260.9 | | - | | 9,260.9 | | Break Bulk Gen. | | 9,731.0 | | 1,708.1 | | 11,439.1 | | Vehicles | | 7,726.9 | | 190.5 | | 7,917.4 | | Logs | | - | | 61,669.5 | | 61,669.5 | | Rubber (Crates) | | - | | 28,089.3 | | 28,089.3 | | Total: | | 108,801.1 | | 91,662.4 | | 200,463.5 | | RELIEF SUPPLIES | | | | | | | | Bulgar Wheat | | 20,168.8 | | 1,512.9 | | 21,681.7 | | Beans/Lentils | | 5,253.0 | | 345.0 | | 5,598.0 | | CSB | | 3,126.2 | | 156.5 | | 3,282.7 | | Others | | 4,815.7 | | 837.5 | | 5,653.2 | | Total: | | 33,363.7 | | 2,851.9 | | 36,215.6 | | CONTAINER | | | | | | | | Container Cargo | | 132,001.6 | | 29,094.1 | | 161,095.7 | | Container Tare | | 20,482.0 | | 19,342.4 | | 39,824.4 | | Transit Container | | - | | - | | - | | Total: | | 152,483.6 | | 48,436.5 | | 200,920.1 | | GRAND TOTAL: | | 445,126.6 | | 166,857.8 | | 611,984.4 |
|
 |
 |
CONTAINER TRAFFIC BY AGENCY IN UNITS AND (TEUS)
| AGENCY | IMPORT | EXPORT | TOTAL | | Umarco | 3,638(4,459) | 3,485(4,251) | 7,113(8,710) | | Denco | 2,287(2,798) | 2,169(2,663) | 4,456(5,461) | | Scanship | 1,466(1,738) | 1,361(1,637) | 2,827(3,375) | | Camer | 244(244) | 226(226) | 470(470) | | Oceanship | 6(7) | 1(1) | 7(8) | | Total: | 7,631(9,246) | 7,242(8,778) | 14,873(18,024) |
|
SUMMARY OF CARGO THROUGHPUT IN CUBIC METRES & METRIC TONS 1998/1999
| Port Description | 1998 | 1999 | | Cubic Metres | Metric Tons | Cubic Metres | Metric Tons | | Buchanan | - | 19,416.48 | 7,231.899 | 6,385.77 | | Greenville | 28,040.502 | 24,759.76 | 59,133.828 | 52,215.17 | | Harper | - | 22,218.90 | - | 42,822.19 | | Total | | 66,395.14 | | 101,423.13 |
|
VESSEL TURN AROUND TIME (TAT) PER SHIFT AT THE MAIN WHARF
MONTH
| FIRST SHIFT | SECOND SHIFT | TOTAL | | January | 18 | 3 | 21 | | February | 17 | 5 | 22 | | March | 22 | 5 | 27 | | April | 21 | 4 | 25 | | May | 16 | 4 | 20 | | June | 22 | 5 | 27 | | July | 13 | 5 | 18 | | August | 12 | 7 | 19 | | September | 19 | 1 | 20 | | October | 11 | 4 | 15 | | November | 18 | 2 | 20 | | December | 15 | 1 | 16 | | Total: | 204 | 46 | 250 |
|
VESSEL AT THE MAIN WHARF AVERAGE PORT, BERTH AND WAITING TIMES IN HOURS
1998 AND 1999
| Month | Ave. Port Time | Ave. Berth Time | Ave. Waiting Time | | 1998 | 1999 | 1998 | 1999 | 1998 | 1999 | | January | 56.3 | 57.8 | 38.4 | 50.0 | 17.9 | 7.8 | | February | 59.9 | 48.7 | 46.6 | 43.4 | 13.3 | 5.3 | | March | 53.1 | 57.1 | 43.7 | 41.2 | 9.4 | 15.9 | | April | 84.3 | 75.0 | 75.1 | 67.2 | 9.2 | 7.8 | | May | 60.2 | 76.5 | 47.6 | 60.7 | 12.6 | 15.8 | | June | 67.0 | 74.3 | 56.8 | 65.3 | 10.2 | 9.0 | | July | 78.5 | 78.4 | 62.4 | 71.4 | 16.1 | 7.0 | | August | 50.5 | 36.3 | 42.1 | 31.6 | 8.4 | 4.7 | | September | 53.1 | 17.7 | 44.8 | 13.2 | 8.3 | 4.5 | | October | 53.5 | 37.5 | 45.6 | 31.4 | 7.9 | 6.1 | | November | 53.3 | 46.5 | 43.9 | 40.4 | 9.4 | 6.2 | | December | 32.9 | 35.1 | 27.3 | 31.1 | 5.6 | 4.0 | | Total | 702.6 | 640.9 | 574.3 | 546.8 | 128.3 | 94.1 | | Year Ave. | 58.6 | 53.4 | 47.9 | 45.6 | 10.7 | 7.8 |
|
 |
|
© World INvestment NEws, 2001.
This is the electronic edition of the special country report on Liberia published in Far Eastern Economic Review.
June 21st, 2001 Issue.
Developed by AgenciaE.Tv |
|
| | | | |
| |
|

